A timeline of the resurgence of the dumb phone
 | March 31, 2026 | 6 min read |
For over a decade, smartphones have become central to everyday life. Long gone are the days when we viewed our phones as only simple tools for making calls; today, smartphones handle a wide range of tasks, including managing schedules and finances, capturing moments through photos and videos, making purchases, controlling household appliances, and providing entertainment. For this reason, mobile technology seemed to be on a trajectory toward larger screens, faster processors, higher storage capacities, and enhanced functionality.
While the “more is better” mentality persists among many major phone manufacturers, not everyone shares this view. According to sales data, more people are reassessing their screen time, and others are questioning smartphone data privacy and the extent of personal information these devices collect.
As discussions about the impact of smartphones on mental health and digital safety have grown, there has been a surprising resurgence of “dumb phones” (non-smartphones) in the market. To understand the reasons behind this shift, Ooma is examining the rise in popularity of basic phones over the past several years.
Smartphones versus dumb phones
As their names imply, smartphones and dumb phones sit at opposite ends of the spectrum in terms of communication devices. In essence, a smartphone is basically a computer that fits in your pocket. They have large screens, high-quality cameras, and a wide range of customizable options for layout and function. These devices support internet browsing, music and video streaming, social media, and a range of utility apps. While about 98% of Americans own a cell phone, 91% own a smartphone, an increase of 35% since 2011.
On the other hand, dumb phones, also called brick or basic phones, are communication devices that typically lack internet connectivity. Although some models support simple games or photo-taking, they have limited app availability and primarily serve to make phone calls or send text messages. Most of these devices don’t have a standard QWERTY keyboard and instead use a T9 number pad for texting. Because these phones lack fast internet access and social media, users will experience significantly fewer distractions and notifications, allowing them to remain reachable while avoiding the constant distractions of online platforms.
Benefits of dumb phones
One of the primary reasons for the dumb phone comeback is the growing desire for a digital detox. Americans spend an average of more than five hours per day on their phones. While many use their phones for productivity and work, much of that time is spent on social media or watching short-form videos. Excessive screen time can negatively affect sleep, attention span, and overall mental health, and these effects are even more pronounced in children’s developing brains. For many, the constant barrage of notifications has become a source of stress rather than convenience. By switching to a device without infinite scroll, users can reclaim hours of their day that were previously lost to mindless browsing and help prevent their children from excessive screen time use.
Furthermore, data privacy concerns may be contributing to the rise in dumb phone popularity. Although smartphones are more secure than PCs, the sheer volume of user data they collect, from location tracking to purchase history, has led some consumers to seek alternatives. Brick phones are inherently more secure because they have fewer apps and less connectivity, reducing opportunities for advertising or data collection.
Finally, many dumb phones are so simple that they often have longer battery life than smartphones. Some models can run for several days on a single charge. This reliability makes them attractive to users who travel frequently, work in physically demanding environments, or want a dependable backup device.
Smartphone and dumb phone imports from 2007–2024
According to U.S. import data from the past 17 years, smartphones had already outsold dumb phones by 2007. That year, 236,155,937 smartphone units were imported, compared to only 14,571,023 dumb phones. Between 2007 and 2014, smartphones became the standard as app marketplaces expanded and mobile internet speeds improved. Smartphone imports climbed to more than 241 million units by 2014, with a customs value approaching $52 billion. Meanwhile, dumb phone imports dropped to roughly 11.2 million units, though the numbers began to increase from there. Dumb phone imports increased from approximately 9.2 million units in 2015 to more than 15.2 million units by 2019. This growth is aligned with growing public discourse on screen time management and digital detox practices.
There was a sharp increase in imports in 2022, as a correction for the supply chain issues of the COVID-19 pandemic, with dumb phone imports rising to nearly 18.9 million. During the same year, smartphone imports reached approximately 173.8 million units.
Although dumb phone import numbers declined slightly after 2022, they remained above levels seen throughout much of the mid-2010s. While these numbers are significantly lower than overall smartphone volumes, they indicate strong demand for simple phones. Many consumers are seeking ways to reduce their screen time and protect their data while staying connected.
Choosing a simpler device is a way to set boundaries and make sure your technology is working for you, and not the other way around. An internet-based home phone is a great way to keep you connected to friends and family while providing a meaningful separation from all the notifications, doomscrolling and spam associated with smartphones. Companies like Ooma have been bundling their free home phone VoIP service with a variety of fun retro and novelty phones to make digital detoxing easier without sacrificing style.
Data on the revival of the dumb phone
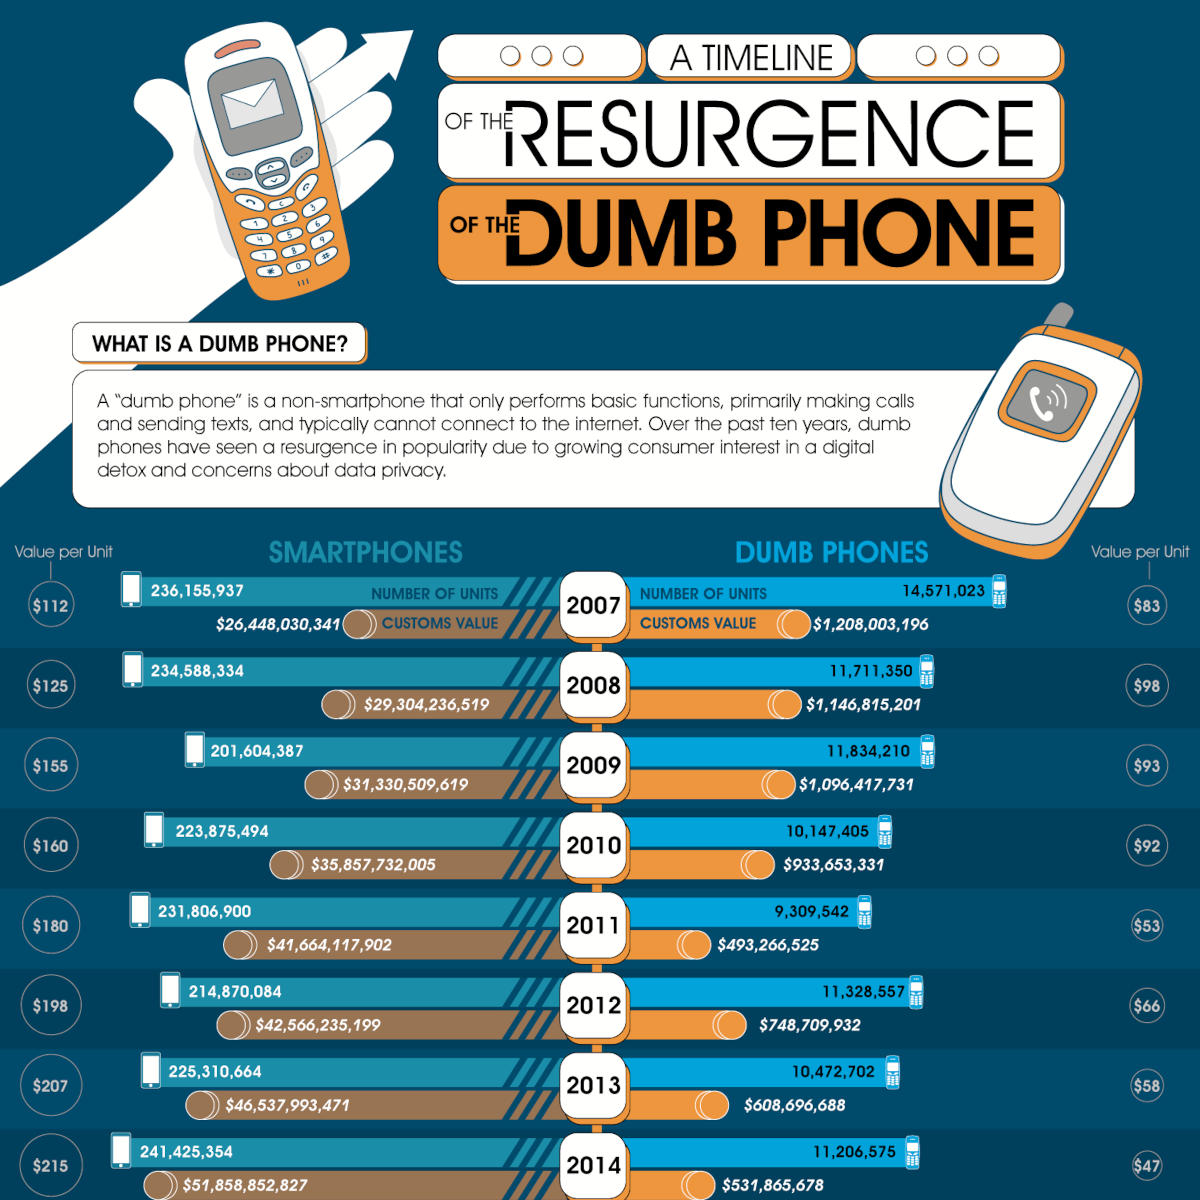
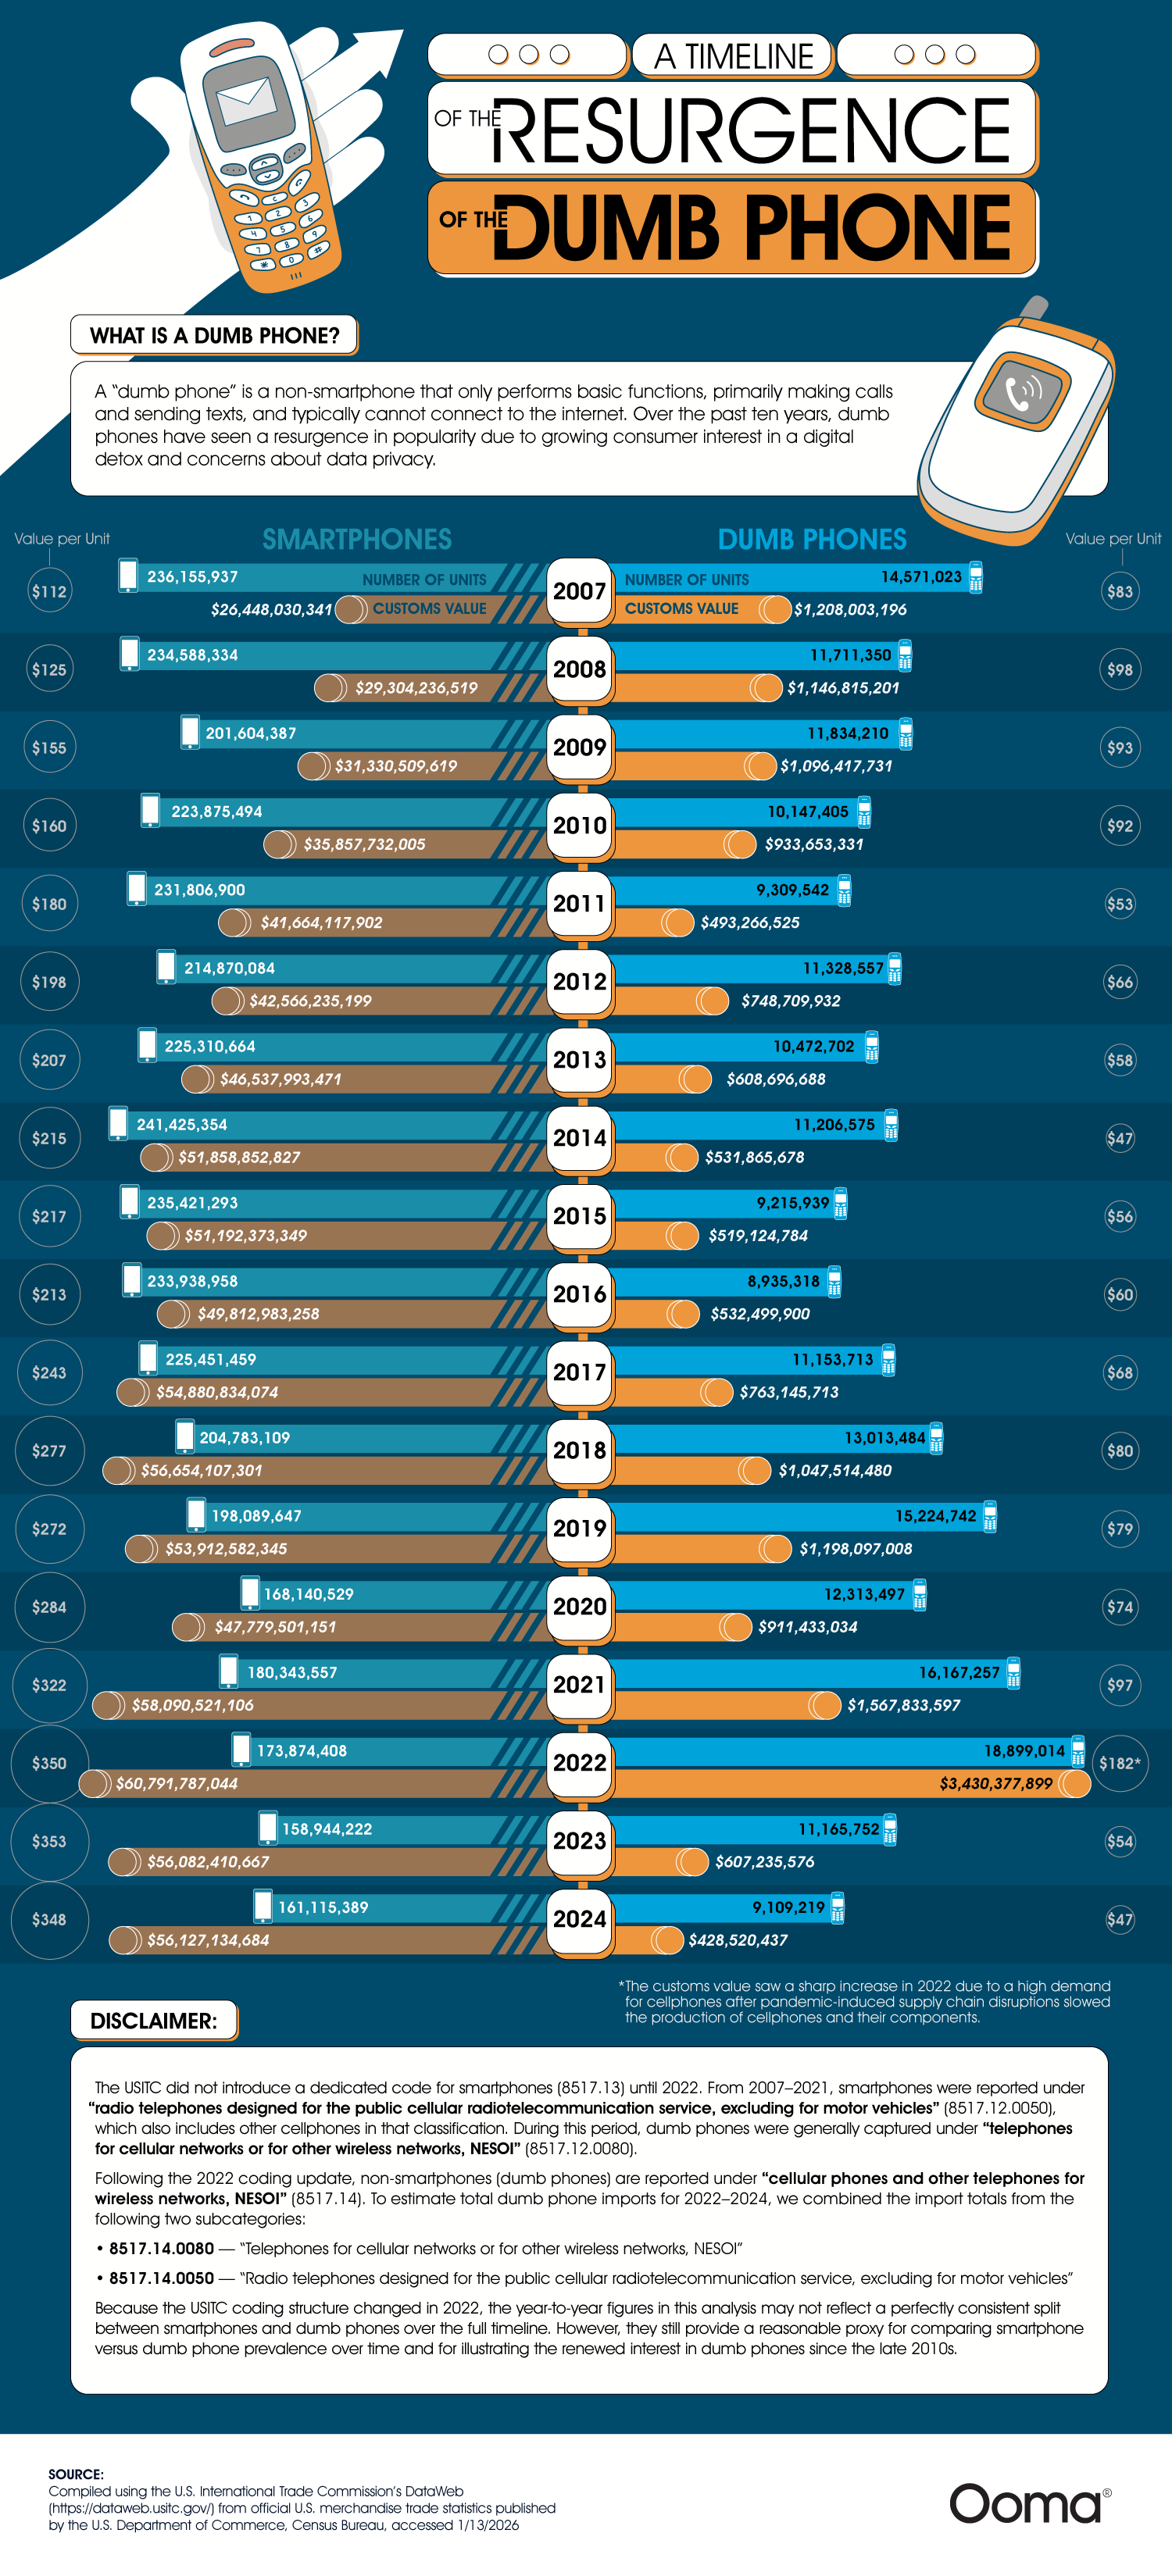
What is a dumb phone?
A “dumb phone” is a non-smartphone that only performs basic functions, primarily making calls and sending texts, and typically cannot browse the internet. Over the past ten years, dumb phones have seen a resurgence in popularity due to growing consumer interest in digital detoxing and concerns about data privacy.
Disclaimer
The USITC did not introduce a dedicated code for smartphones (8517.13) until 2022. From 2007–2021, smartphones were reported under “radio telephones designed for the public cellular radiotelecommunication service, excluding for motor vehicles” (8517.12.0050), which also includes other cellphones in that classification. During this period, dumb phones were generally captured under “telephones for cellular networks or for other wireless networks, NESOI” (8517.12.0080).
Following the 2022 coding update, non-smartphones (dumb phones) are reported under “cellular phones and other telephones for wireless networks, NESOI” (8517.14). To estimate total dumb phone imports for 2022–2024, we combined the import totals from the following two subcategories:
- 8517.14.0080 — “Telephones for cellular networks or for other wireless networks, NESOI”
- 8517.14.0050 — “Radio telephones designed for the public cellular radiotelecommunication service, excluding for motor vehicles”
Because the USITC coding structure changed in 2022, the year-to-year figures in this analysis may not reflect a perfectly consistent split between smartphones and dumb phones over the full timeline. However, they still provide a reasonable proxy for comparing smartphone versus dumb phone prevalence over time and for illustrating the renewed interest in dumb phones since the late 2010s.
| SMARTPHONES | Year | DUMB PHONES | ||||
|---|---|---|---|---|---|---|
| Value per Unit | Customs Value | Number of Units | Customs Value | Number of Units | Value per Unit | |
| $112 | $26,448,030,341 | 236,155,937 | 2007 | $1,208,003,196 | 14,571,023 | $83 |
| $125 | $29,304,236,519 | 234,588,334 | 2008 | $1,146,815,201 | 11,711,350 | $98 |
| $155 | $31,330,509,619 | 201,604,387 | 2009 | $1,096,417,731 | 11,834,210 | $93 |
| $160 | $35,857,732,005 | 223,875,494 | 2010 | $933,653,331 | 10,147,405 | $92 |
| $180 | $41,664,117,902 | 231,806,900 | 2011 | $493,266,525 | 9,309,542 | $53 |
| $198 | $42,566,235,199 | 214,870,084 | 2012 | $748,709,932 | 11,328,557 | $66 |
| $207 | $46,537,993,471 | 225,310,664 | 2013 | $608,696,688 | 10,472,702 | $58 |
| $215 | $51,858,852,827 | 241,425,354 | 2014 | $531,865,678 | 11,206,575 | $47 |
| $217 | $51,192,373,349 | 235,421,293 | 2015 | $519,124,784 | 9,215,939 | $56 |
| $213 | $49,812,983,258 | 233,938,958 | 2016 | $532,499,900 | 8,935,318 | $60 |
| $243 | $54,880,834,074 | 225,451,459 | 2017 | $763,145,713 | 11,153,713 | $68 |
| $277 | $56,654,107,301 | 204,783,109 | 2018 | $1,047,514,480 | 13,013,484 | $80 |
| $272 | $53,912,582,345 | 198,089,647 | 2019 | $1,198,097,008 | 15,224,742 | $79 |
| $284 | $47,779,501,151 | 168,140,529 | 2020 | $911,433,034 | 12,313,497 | $74 |
| $322 | $58,090,521,106 | 180,343,557 | 2021 | $1,567,833,597 | 16,167,257 | $97 |
| $350 | $60,791,787,044 | 173,874,408 | 2022 | $3,430,377,899 | 18,899,014 | $182* |
| $353 | $56,082,410,667 | 158,944,222 | 2023 | $607,235,576 | 11,165,752 | $54 |
| $348 | $56,127,134,684 | 161,115,389 | 2024 | $428,520,437 | 9,109,219 | $47 |
*The customs value saw a sharp increase in 2022 due to a high demand for cellphones after pandemic-induced supply chain disruptions slowed the production of cellphones and their components.
Source:
Compiled using the U.S. International Trade Commission’s DataWeb from official U.S. merchandise trade statistics published by the U.S. Department of Commerce, Census Bureau, accessed 1/13/2026.
Husain Sumra is a former journalist who reported on the biggest companies in tech, from Apple to Amazon, covering cloud services, consumer technology and communication solutions. His journalism background has helped him bring a customer-first approach to content marketing, creating pieces of content aimed at helping people.