30 Statistics About Cutting the Cord in the United States
 | December 9, 2025 | 9 min read |
These days, with the growing number of gadgets in our lives, it seems like there are more cables than ever in our homes. But while the USB and HDMI cables multiply, two types of cords are rapidly disappearing from our households: telephone and cable TV. Just a couple of decades ago, nearly every home had at least one landline and likely basic cable service as well. However, these once-essential luxuries are now becoming relics of the past.
Sometimes called “cutting the cord,” this trend reflects the rapidly changing communication and media technology that has totally transformed how we connect to the world. To better understand the true scope of this movement, the team at Ooma has uncovered 30 facts about cutting the cord in the U.S.
Why people are cutting the cord
Cutting the cord has become the popular way to describe the widespread cancellation of traditional cable and landline phone services. Thanks to advances in Wi-Fi technology and improved internet service, it’s now easier for people to choose services that only require an internet connection or cell service and a smart device.
Anyone who’s paid for cable knows that the main driving factor for cutting the cord is cost. In a recent survey, 73 percent of people who canceled their cable said they did so because it was simply too expensive, a decision made even easier by ever-rising prices. In 2024, six of the nine major cable providers increased their broadcast TV fees by an average of 12.8 percent, adding about $21.48 to their customers’ monthly bills. Adding it all up, cord-cutters save about $1,000 annually by canceling cable.
Beyond the cost, a significant portion of consumers are canceling their cable subscriptions because they believe they no longer need cable TV to watch what interests them. The rise of on-demand streaming services like Netflix and Hulu gives viewers unprecedented control over their entertainment. Instead of tuning in at a specific time set by a network, which includes minutes of unskippable ads, people can now watch entire seasons of their favorite shows whenever they want.
Cable TV cord-cutters and the rise of streaming services
Nearly half of all American households are without cable, and another 12 percent are “cord-nevers,” meaning they have never subscribed to any form of traditional pay TV.
While many factors contribute to the decline in cable TV subscribers over time, it correlates quite strongly with the rise of streaming services in the 2010s. Netflix launched its revolutionary streaming service in 2007, and in the years that followed, it seemed like everyone wanted a piece of the pie. Now, with so many services offering original content at prices far below cable’s, many see no need for the more traditional service.
However, whether the move to streaming is worth it depends greatly on your location. Residents in Delaware currently enjoy the biggest monthly savings, an average of $75.34. On the other end of the spectrum, people in Montana save just $11.63 per month by cutting cable TV. This difference is due to disparities in the cost and availability of high-speed broadband internet access across the country. For example, Montana has the highest average internet service cost in the country, at $123.37 per month. When considering the price of streaming services, that $123 internet bill really eats into any potential savings from cutting out cable. Meanwhile, in states with cheaper, more competitive internet service costs, like Nebraska, where broadband costs an average of $55.04 per month, cutting the cord is a great deal.
The disappearing landline phone
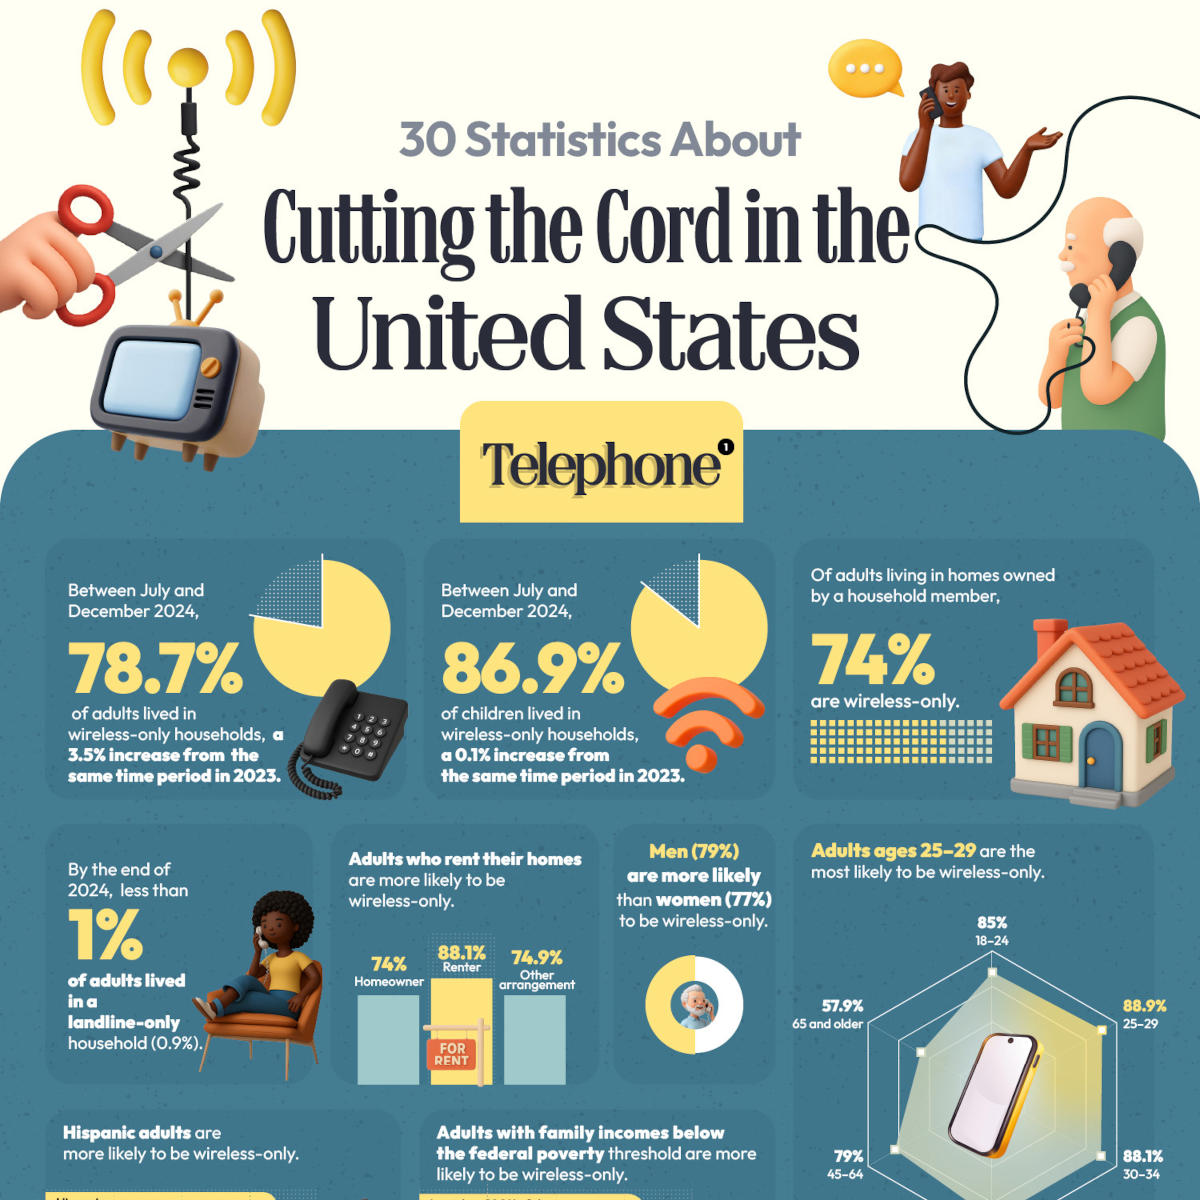
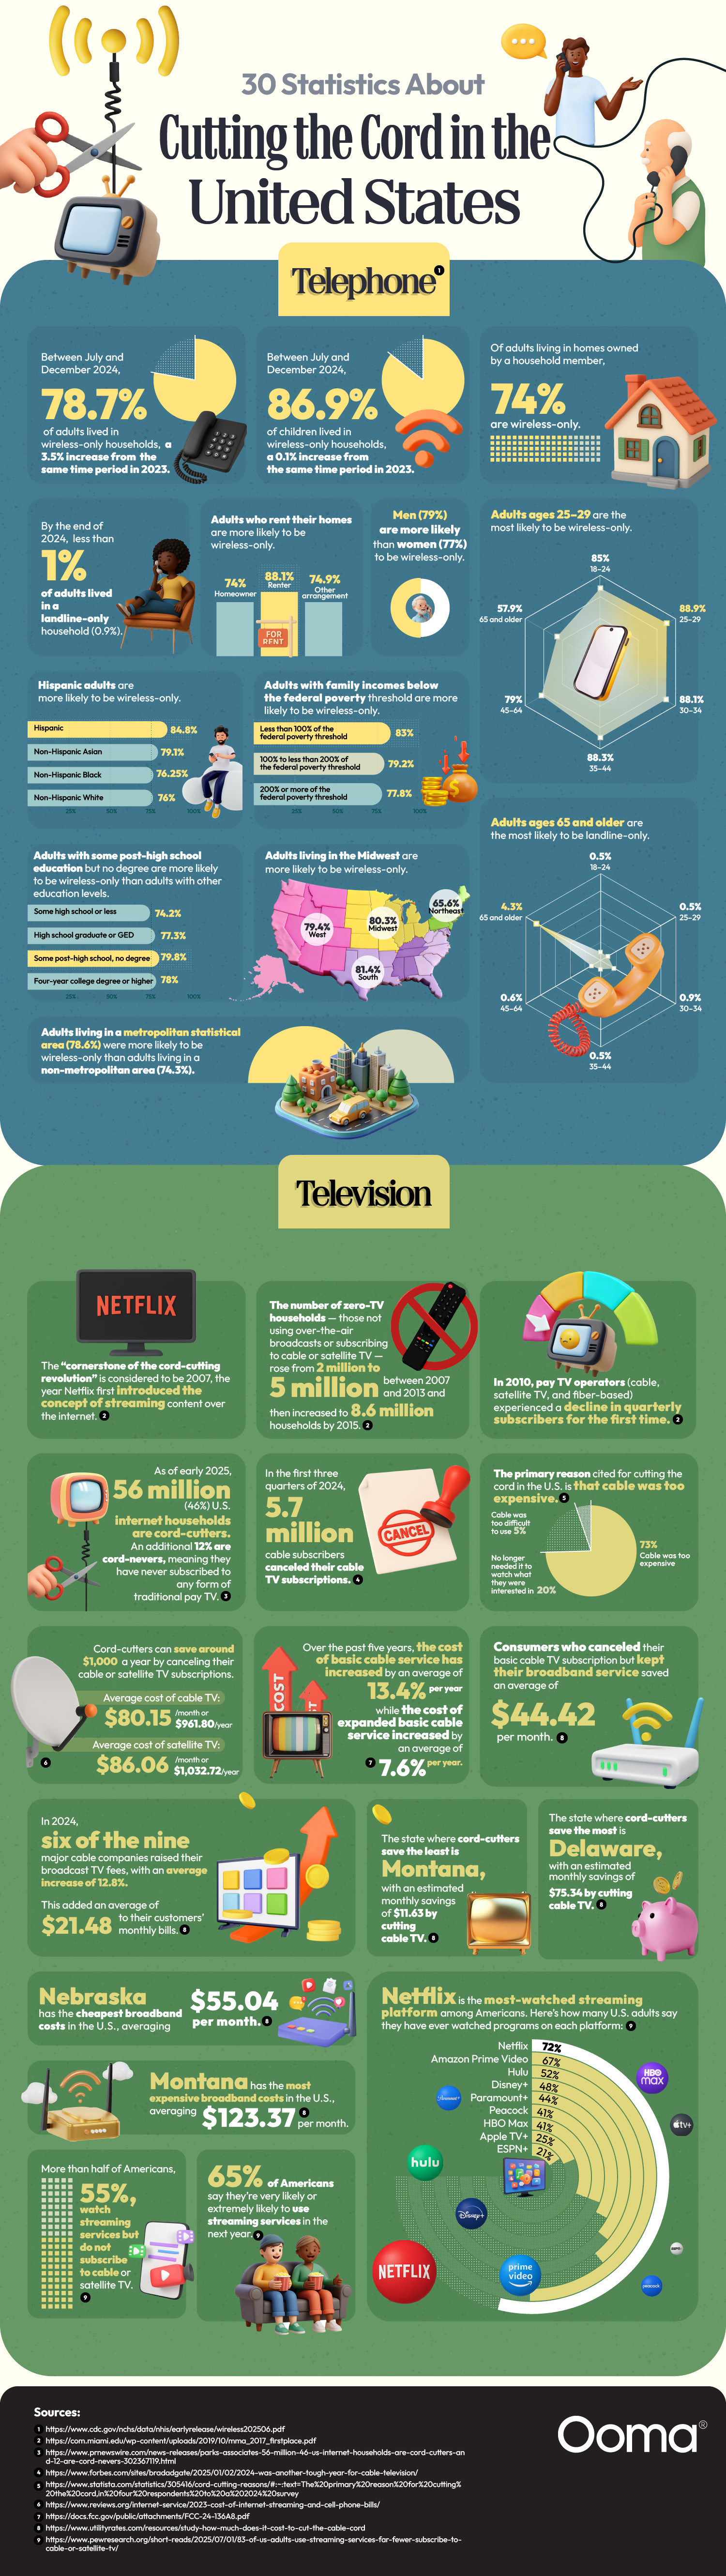
Throughout the 20th century and much of the early 2000s, landlines served as the central communication hub for households. However, the rise in cell phone popularity and improved cell service have made telephone cord-cutters the new normal. Currently, 78.7 percent of adults and 86.9 percent of children live in wireless-only households.
Landline-only households have become a true rarity, accounting for less than 1 percent of adults by the end of 2024. This shift is most pronounced among adults ages 25 to 44, with more than 88 percent living in homes without a landline. In contrast, adults ages 65 and older are the most likely to retain a landline, though even in that demographic, a majority (57.9 percent) have switched to wireless-only.
Factors like income and location also play key roles in who’s cutting the cord. Lower-income families and those who rent instead of owning are more likely to be wireless-only. Regional patterns also exist: Those living in the South and Midwest are more likely to rely solely on wireless service, while the Northeast still has the highest proportion of landline users.
It’s clear that cord-cutting is becoming the new standard for Americans, and it’s a trend that doesn’t appear to be slowing down. Millions of Americans have shown that convenience, freedom and cost are important factors in choosing which services to subscribe to and which technologies to incorporate into their lives.
If you’re ready to explore better ways to stay connected, we can help. From VoIP (voice over internet protocol) phone systems that make business communications seamless to home solutions designed for simplicity and savings, Ooma gives you the tools to cut the cord with confidence. View and compare our plan options to learn more and see how easy it can be to make the switch.
30 statistics about cutting the cord
Telephone
| Telephone Statistics | Source Number |
|---|---|
| Between July and December 2024, 78.7 percent of adults lived in wireless-only households, a 3.5 percent increase from the same time period in 2023. | 1 |
| Between July and December 2024, 86.9 percent of children lived in wireless-only households, a 0.1 percent increase from the same time period in 2023. | 1 |
| Of adults living in homes owned by a household member, 74 percent are wireless-only. | 1 |
| By the end of 2024, less than 1 percent of adults lived in a landline-only household (0.9 percent). | 1 |
| Adults who rent their homes are more likely to be wireless-only. • Homeowner: 74 percent • Renter: 88.1 percent • Other arrangement: 74.9 percent | 1 |
| Adults ages 25–29 are the most likely to be wireless-only. • 18–24: 85 percent • 25–29: 88.9 percent • 30–34: 88.1 percent • 35–44: 88.3 percent • 45–64: 79 percent • 65 and older: 57.9 percent | 1 |
| Adults ages 65 and older are the most likely to be landline-only. • 18–24: 0.5 percent • 25–29: 0.5 percent • 30–34: 0.9 percent • 35–44: 0.5 percent • 45–64: 0.6 percent • 65 and older: 4.3 percent | 1 |
| Men (79 percent) are more likely than women (77 percent) to be wireless-only. | 1 |
| Hispanic adults are more likely to be wireless-only. • Hispanic: 84.8 percent • Non-Hispanic Asian: 79.1 percent • Non-Hispanic black: 76.25 percent • Non-Hispanic white: 76 percent | 1 |
| Adults with family incomes below the federal poverty threshold are more likely to be wireless-only. • Less than 100 percent of the federal poverty threshold: 83 percent • 100 percent to less than 200 percent of the federal poverty threshold: 79.2 percent • 200 percent or more of the federal poverty threshold: 77.8 percent | 1 |
| Adults with some post-high school education but no degree are more likely to be wireless-only than adults with other education levels. • Some high school or less: 74.2 percent • High school graduate or GED: 77.3 percent • Some post-high school, no degree: 79.8 percent • Four-year college degree or higher: 78 percent | 1 |
| Adults living in the Midwest are more likely to be wireless-only. • Midwest: 80.3 percent • South: 81.4 percent • West: 79.4 percent • Northeast: 65.6 percent | 1 |
| Adults living in a metropolitan statistical area (78.6 percent) were more likely to be wireless-only than adults living in a non-metropolitan area (74.3 percent). | 1 |
Television
| Television Statistics | Source Number |
|---|---|
| The “cornerstone of the cord-cutting revolution” is considered to be 2007, the year Netflix first introduced the concept of streaming content over the internet. | 2 |
| The number of zero-TV households — those not using over-the-air broadcasts or subscribing to cable or satellite TV — rose from 2 million to 5 million between 2007 and 2013 and then increased to 8.6 million households by 2015. | 2 |
| In 2010, pay TV operators (cable, satellite and fiber-based) experienced a decline in quarterly subscribers for the first time. | 2 |
| As of early 2025, 56 million (46 percent) U.S. internet households were cord-cutters. An additional 12 percent are cord-nevers, meaning they have never subscribed to any form of traditional pay TV. | 3 |
| In the first three quarters of 2024, 5.7 million cable subscribers canceled their cable TV subscriptions. | 4 |
| The primary reason cited for cutting the cord in the U.S. is that cable was too expensive. • Cable was too expensive: 73 percent • No longer needed it to watch what they were interested in: 20 percent • Cable was too difficult to use: 5 percent | 5 |
| Cord-cutters can save around $1,000 a year by canceling their cable or satellite TV subscriptions. • Average cost of cable TV: $80.15/month or $961.80/year • Average cost of satellite TV: $86.06/month or $1,032.72/year | 6 |
| Over the past five years, the cost of basic cable service has increased by an average of 13.4 percent per year, while the cost of expanded basic cable service increased by an average of 7.6 percent per year. | 7 |
| Consumers who canceled their basic cable TV subscription but kept their broadband service saved an average of $44.42 (36 percent) per month. | 8 |
| In 2024, six of the nine major cable companies raised their broadcast TV fees, with an average increase of 12.8 percent. This added an average of $21.48 to their customers’ monthly bills. | 8 |
| The state where cord-cutters save the most is Delaware, with an estimated monthly savings of $75.34 by cutting cable TV. | 8 |
| The state where cord-cutters save the least is Montana, with an estimated monthly savings of $11.63 by cutting cable TV. | 8 |
| Nebraska has the cheapest broadband costs in the U.S., averaging $55.04 per month. | 8 |
| Montana has the most expensive broadband costs in the U.S., averaging $123.37 per month. | 8 |
| More than half of Americans, 55 percent, watch streaming services but do not subscribe to cable or satellite TV. | 9 |
| Sixty-five percent of Americans say they’re very likely or extremely likely to use streaming services in the next year. | 9 |
| Netflix is the most-watched streaming platform among Americans. Here’s how many U.S. adults say they have ever watched programs on each platform: • Netflix: 72 percent • Amazon Prime Video: 67 percent • Hulu: 52 percent • Disney+: 48 percent • Paramount+: 44 percent • Peacock: 41 percent • HBO Max: 41 percent • Apple TV+: 25 percent • ESPN+: 21 percent | 9 |
Sources:
- Wireless Substitution: Early Release of Estimates from the National Health Interview Survey, July-December 2024
- Cord Cutting: A Digital Revolution of Media Consumption
- Parks Associates: 56 million (46%) US Internet Households are Cord Cutters, and 12% are Cord Nevers
- 2024 Was Another Tough Year For Cable Television Industry
- Primary reasons for cutting the cord in the United States as of February 2024
- The State of Consumer Media Spending in 2023: How Much Are Americans Spending on Internet, Phone, and TV?
- 2024 Report On Cable Industry Prices
- Study – How Much Does It Cost to Cut the Cable Cord?
- 83% of U.S. adults use streaming services, far fewer subscribe to cable or satellite TV
Husain Sumra is a former journalist who reported on the biggest companies in tech, from Apple to Amazon, covering cloud services, consumer technology and communication solutions. His journalism background has helped him bring a customer-first approach to content marketing, creating pieces of content aimed at helping people.